Unlocking Tomorrow's Cures: Predicting Clinical Trial Enrollment with Data Science Modeling, Part 2
Abhinav Chaturvedi & Amar Vaish, Senior Technology Consultants, Calance | 21 Nov 2023
We looked at the approach to model enrollment prediction for a site during a clinical trial in our previous article Enrollment Prediction for Clinical Trials - Part 1. In this article, we will explore the methodology to model the same for a protocol.
When modelling patient enrollment for an entire protocol, there are several additional factors to consider compared to modelling for a single site. Firstly, protocols often involve multiple sites with different enrollment rates and patterns, making considering site-level heterogeneity in the modelling process essential. This can be achieved by incorporating site-specific parameters in the modelling approach, such as site-level average enrollment rate, variability, and correlation between sites. Additionally, it may be necessary to consider external factors impacting enrollment, such as recruitment efforts, eligibility criteria, and patient demographics.
Furthermore, when modelling patient enrollment for an entire protocol, it is crucial to account for the potential impact of site activation on the overall enrollment timeline. Site activation can often be a lengthy process, and delays in activation can significantly impact the timeline for enrollment. Therefore, it may be necessary to incorporate a delay period in the modelling approach to account for the time required for site activation. Additionally, the modelling approach should consider adding new sites or discontinuing underperforming sites during the trial, which can significantly impact enrollment patterns. In summary, modelling patient enrollment for an entire protocol requires a more complex approach that considers site-level heterogeneity, external factors, and the impact of site activation and modifications on enrollment patterns.
Methodology
Clinical trials are complex endeavours that require the recruitment of many patients to ensure that the study has enough statistical power to yield meaningful results. One of the main challenges researchers face is the accurate prediction of patient enrollment numbers for the entire protocol. To address this challenge, a methodology has been developed to cluster the sites in the protocol based on their study duration and weekly enrollment rate. This methodology can help to accurately predict patient enrollment for a protocol and ensure that the study has enough statistical power to yield meaningful results.
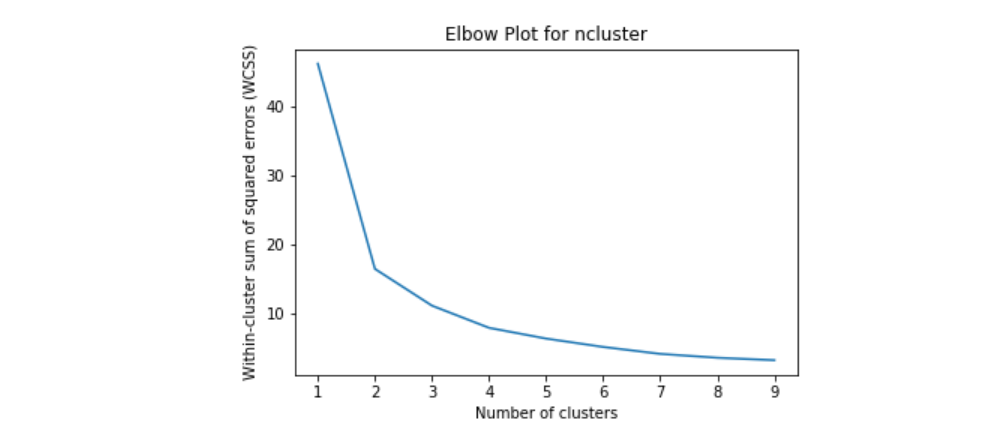
The first step in the methodology is to cluster the sites in the protocol based on their study duration and enrollment rate per week. The clustering is done based on the Elbow plot and Silhouette scores. The Elbow plot helps to determine the optimal number of clusters for the data by plotting the within-cluster sum of squares against the number of clusters. The Silhouette score measures how well each data point fits into its assigned cluster. The optimal number of clusters is determined by selecting the number of clusters with the highest Silhouette score.
K-means clustering is a type of unsupervised learning algorithm that is used to group similar data points. It is a powerful tool in data mining, image processing, and many other fields. K-means clustering aims to partition a given dataset into K clusters, where each data point belongs to the cluster with the nearest mean.
To understand K-means clustering, let us take an example. Suppose we have a dataset of customer information for a retail store. This dataset includes customer age, gender, income, and spending habits. We want to use K-means clustering to group customers with similar spending habits together so that we can create targeted marketing campaigns for each group.
The first step in K-means clustering is randomly selecting K initial centroids (or means). The centroids represent the centres of the clusters we want to create. In our example, K represents the number of spending habit groups we want to create.
Once we have selected the initial centroids, we assign each data point to the nearest centroid. We calculate the distance between each data point and each centroid and assign the data point to the centroid with the shortest distance. This process is repeated until all data points have been assigned to a centroid.
After all data points have been assigned to a centroid, we recalculate the position of each centroid. We do this by taking the average of each cluster's data points, and this new position becomes the new centroid for that cluster.
We repeat the process of assigning data points to the nearest centroid and recalculating the centroids until the centroids no longer move. This means that the clusters have converged, and the K-means algorithm has found the optimal grouping of data points.
Once we have completed the K-means algorithm, we can analyse the results to gain insights into the data. In our retail store example, we can use the spending habits of each group to create targeted marketing campaigns. For example, one group spends more on electronics than any other group, so we could create a marketing campaign that focuses on electronics for that group.
K-means clustering has many advantages over other clustering algorithms. It is simple to understand and easy to implement. It is also computationally efficient, which makes it a good choice for large datasets. However, K-means clustering also has some limitations. It assumes that clusters are spherical and have the same variance, which may only sometimes be true in real-world data. It also requires us to specify the number of clusters (K) in advance, which may not be known in some cases.
In conclusion, K-means clustering is a powerful tool for grouping similar data points. It is commonly used in data mining, image processing, and many other fields. Using K-means clustering, we can gain insights into the data and make informed decisions based on those insights.
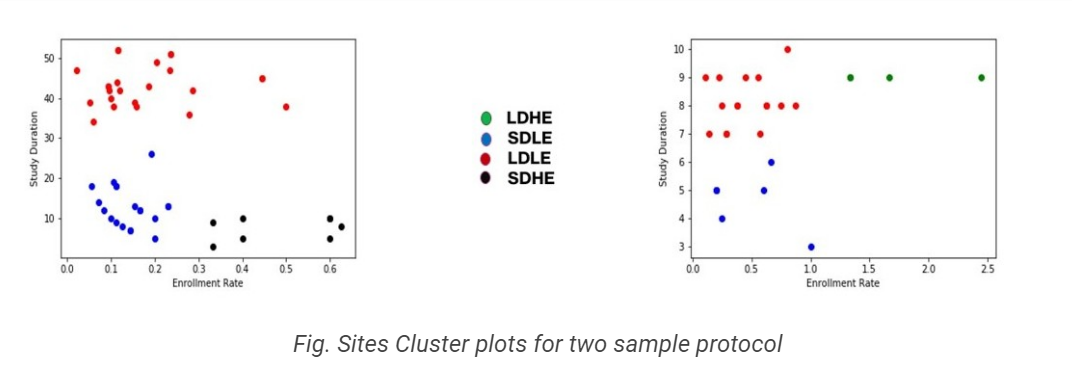
Once the sites have been clustered, they are assigned to one of four clusters based on their study duration and weekly enrollment rate. The four clusters are Long duration high enrollment (LDHE), Short duration low enrollment (SDLE), Long duration low enrollment (LDLE), and Short duration high enrollment (SDHE). Each cluster represents a different enrollment profile, with some clusters having a higher enrollment rate and shorter study duration and others having a lower enrollment rate and longer study duration.
For each cluster label, the following steps are performed to model a new site as per the cluster label profile:
- Calculate the planned enrollment rate based on the mean enrollment rate of all the sites within the cluster. Calculate the planned study duration based on the mean study duration of all the sites in the cluster. This step ensures that the planned enrollment rate and study duration are consistent with the enrollment profile of the cluster.
- Generate a random enrollment count based on the planned enrollment rate above via the Poisson process for the planned study duration. The Poisson process is a mathematical model used to predict the number of events occurring during a specific period. In this case, the Poisson process predicts the number of patients enrolled during the planned study duration.
- After each week, the planned enrollment rate is updated based on the actual enrollment rate for that week. This ensures that the planned enrollment rate remains accurate as the study progresses.
- Add the expected counts for each week to get the total enrollment count for the site. This step ensures that the expected enrollment count is consistent with the enrollment profile of the cluster.
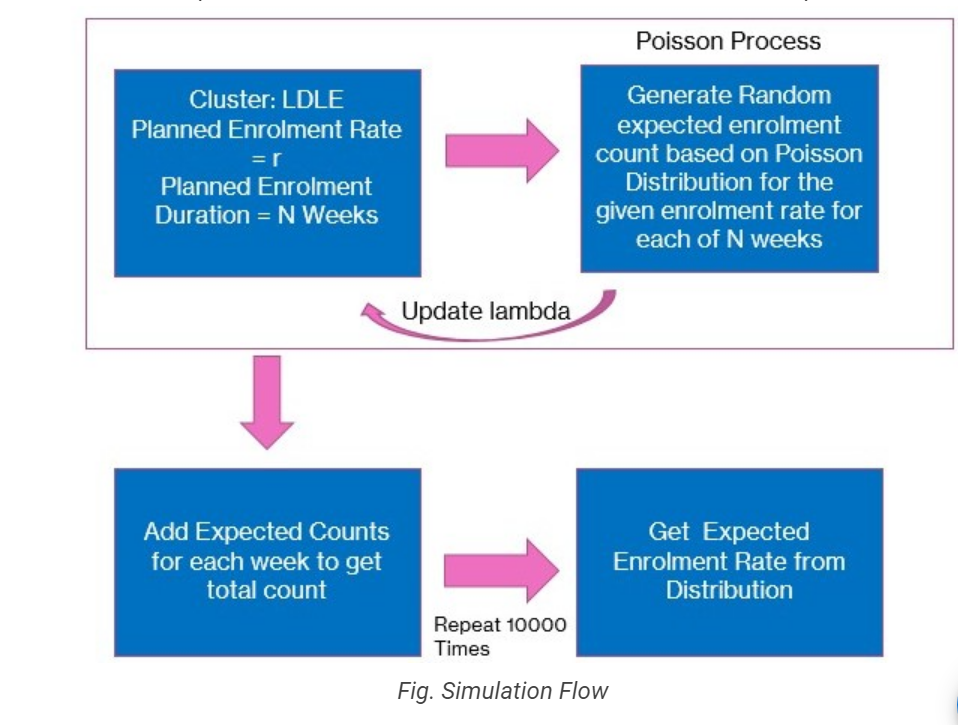
To further refine the enrollment predictions, the above steps are simulated (MC Simulation) 10000 times to get the distribution of total expected enrollments for the planned study duration. The MC simulation allows for the prediction of a range of enrollment counts, which can be used to inform study planning and resource allocation. This approach is highly effective in predicting patient enrollment for a protocol as it considers the unique characteristics of each site and cluster, allowing for more accurate predictions of enrollment rates and study duration.
In summary, the methodology for modelling patient enrollment for a protocol involves clustering the sites based on their study duration and weekly enrollment rate. The four clusters are Long duration high enrollment (LDHE), Short duration low enrollment (SDLE), Long duration low enrollment (LDLE), and Short duration high enrollment (SDHE). Each cluster label calculates the planned enrollment rate and study duration based on the mean enrollment.
Benefits
The above methodology can yield several benefits in predicting patient enrollment in clinical trials for a given protocol. One of the significant benefits is the ability to forecast total expected enrollments from a newly activated site for a given cluster. By clustering sites based on their study duration and enrollment rate per week, we can identify the average enrollment rate and study duration for each cluster type. Using these averages, we can predict the expected enrollment count for a new site based on its cluster label. This can help clinical trial managers to make informed decisions about the expected enrollment counts from each site and optimize their recruitment strategies accordingly.
Another benefit of the approach is that it can help identify core differences between the sites belonging to different clusters. By analyzing the data, we can identify factors such as patient population density and the cost of site activation that might impact enrollment rates. For example, sites in the SDHE cluster might be located in densely populated areas with easier access to the patient population, leading to higher enrollment rates. Similarly, sites in the LDLE cluster might have a higher activation cost due to the need for specialized equipment or training. By understanding these factors, clinical trial managers can tailor their recruitment strategies to each cluster type and optimize their use of resources.
Finally, the approach can help decide how many cluster-type sites should be activated to meet enrollment targets. By understanding the expected enrollment counts from each cluster type, clinical trial managers can estimate the total enrollment from all sites and allocate resources accordingly. For example, suppose a protocol requires a high enrollment rate. In that case, managers can focus on activating more SDHE or LDHE-type sites. If the protocol is extended, managers can focus on activating more LDLE or LDHE-type sites. This can help optimize resource allocation and improve the chances of meeting enrollment targets.
Evaluation
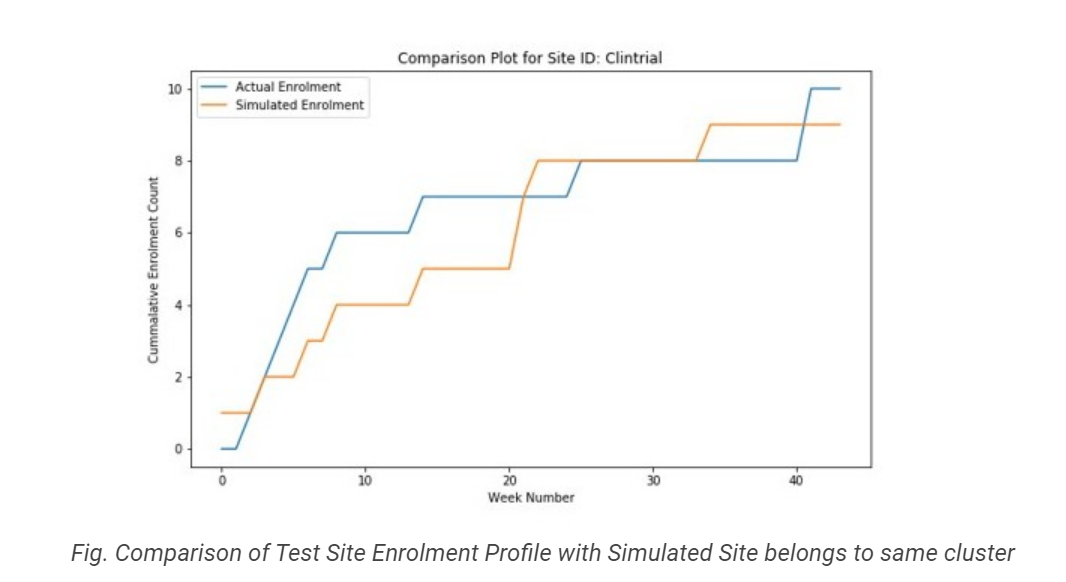
The backtesting process is used to evaluate the performance of a forecasting model on historical data, which can provide insight into how the model would perform on future data. In the case of patient enrollment forecasting using the Site Clustering + Poisson Simulations approach, the backtesting process can be used to evaluate the accuracy of the enrollment forecasts.
The results of the backtest indicate that the forecasts generated by the model have moderate accuracy. This means the model can generate forecasts close to the actual enrollment numbers. However, there is still some level of error. This could be due to various factors, such as unexpected changes in the patient population or site performance.
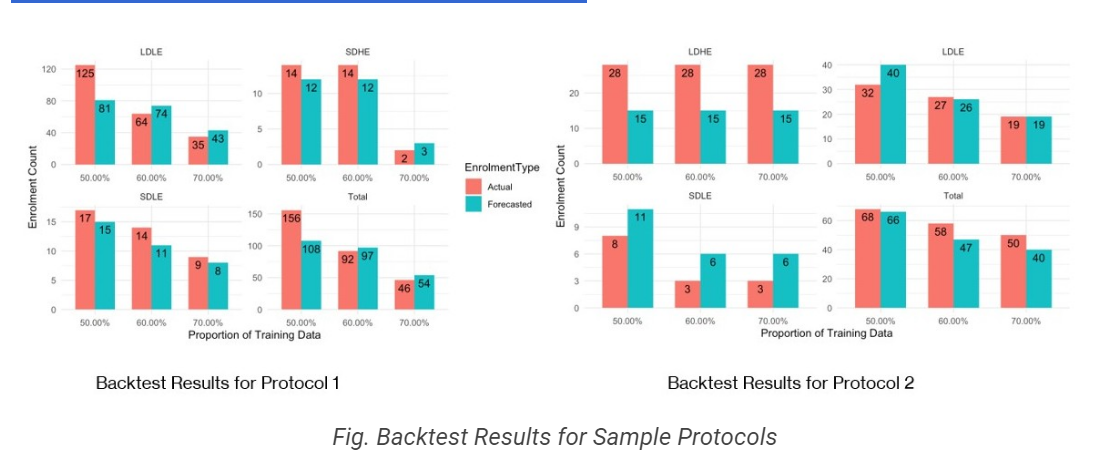
To test the model's accuracy, the historical data is sliced into various subsets, such as 50%, 60%, and 70% of the total historical data. The model is then used to generate forecasts based on each subset of the data, and the actual enrollment numbers are compared to the predicted enrollment numbers for each cluster label. By comparing the actual and predicted enrollment numbers, we can determine how accurate the model is across different subsets of the data.
Overall, the backtest results provide valuable insights into the accuracy of the forecasting model and can be used to refine the model and improve its accuracy in the future. By comparing the forecasts to actual enrollments, the model can be refined to better account for factors that impact patient enrollment, such as patient population density or the cost of activating a site. This can help organizations make more informed decisions about which sites to activate and how many of each cluster type to activate to meet enrollment targets.
Conclusion
In conclusion, the approach of cluster-level modelling for patient enrollment has several advantages. Grouping sites with similar characteristics allows for more accurate predictions of patient enrollment, thereby reducing the risk of underestimation or overestimation of patient numbers. It also enables the identification of core differences between the sites belonging to different clusters, such as patient population density and cost of site activation. This information can be used to determine how many sites of each cluster type should be activated to meet enrollment targets, which can help with resource allocation and management.
The backtest results show that the approach models patient enrollments with moderate accuracy. The model can be tested with various slices of historical data to compare actual and predicted enrollments for each cluster label. This provides a measure of the model's reliability and helps to fine-tune the approach for future use.
Furthermore, the time efficacy of the approach is another potential benefit. The approach saves time and resources by automating the process of clustering and generating predictions. This can be especially valuable in the fast-paced world of clinical trials, where quick decisions and adjustments are often required.
The cluster-level modelling approach has several business benefits, including more accurate predictions, better resource allocation, and time savings. These benefits make it a valuable tool for clinical trial management and planning.
Future Enhancements
Several potential future enhancements to the approach outlined in the previous sections could further improve the accuracy and efficiency of patient enrollment modelling for clinical trials.
One possible area for enhancement is to model the activation mix of new sites as an optimization problem. This would involve considering factors such as the patient population density, activation cost, and the expected enrollment rate for each site and determining the optimal mix of new site activations to maximize the expected enrollment rate while staying within budget constraints.
Another area for enhancement is to model the interactions between sites within a protocol. By considering the interdependencies between sites, such as the impact of one site's enrollment rate on the enrollment rates of other sites within the same protocol, the model could generate more accurate predictions of enrollment rates and help identify strategies to improve enrollment across all sites.
A comprehensive cluster analysis of sites and defining cluster characteristics beyond enrollment behaviour could also provide more detailed insights into the factors contributing to successful patient enrollment. This could include factors such as geographic location, patient demographics, and medical resources and infrastructure availability.
Another area for potential enhancement is to predict a site's enrollment behaviour based on factors such as location and protocol. By analyzing historical data on on-site enrollment rates and comparing this to other factors such as patient demographics and geographical location, the model could identify patterns and correlations that could be used to predict the likely enrollment rates for a new site.
Given a maximum total enrollment for a protocol, the maximum time to achieve the target, the maximum number of sites available, patient population density, and activation cost, the model could also be used to generate optimal site activation and enrollment strategies that would maximize enrollment rates while staying within budget and time constraints.
Overall, these potential enhancements could further improve the accuracy and efficiency of patient enrollment modelling for clinical trials, helping to identify strategies that could improve enrollment rates and reduce costs while staying within budget and time constraints.
Custom IT Solutions
Leverage our capabilities and insights to accelerate your digital transformation
