Predicting Clinical Trial Enrollment with Data Science Modeling : Part 1
Abhinav Chaturvedi & Amar Vaish, Senior Technology Consultants, Calance | 27 Sep 2023
Clinical trials are a vital part of the drug development process. Before a drug can be approved and released for public use, it must undergo a rigorous testing phase to ensure it is safe and effective. One of the challenges in clinical trial design is predicting how many participants will enrol in the trial. Accurate enrollment predictions are critical for determining the sample size needed to achieve statistical significance and estimating the trial's duration and cost.
The pharmaceutical industry confronts a multifaceted challenge in clinical trial enrollment. Accurate prediction of the number of participants required remains elusive, resulting in resource misallocation, delayed trials, and increased costs. These uncertainties hinder timely drug development. Additionally, issues such as poor data quality, patient heterogeneity, evolving regulations, and ineffective recruitment strategies further exacerbate enrollment difficulties, making it imperative to explore data science and predictive modeling solutions to reshape and optimize the clinical trial enrollment process.
In this blog, we will demonstrate our approach to addressing the intricate challenge of predicting clinical trial enrollment. We will unveil the methods, tools, and strategies we employed using data science, demonstrating how we achieved precision in predicting the count of weekly enrolments in clinical trial for a pharmaceutical company. Our journey will include the development of predictive models, and the refinement of enrollment strategies.
Challenges in predicting patient enrollment for a clinical trial
Uncertainty around recruitment timelines: Clinical trials require a significant amount of time and resources to recruit patients, and the timelines for recruitment can be uncertain. Many factors can impact recruitment timelines, such as the complexity of the trial protocol, the availability of eligible patients, and the willingness of patients to participate in the trial.
Variability in a patient population: The patient population for a clinical trial can be highly variable. Predicting how many patients will be eligible and willing to participate can be complex. For example, the patient population may have different demographics, medical histories, or disease severities that can impact recruitment.
Competition with other trials: Patients may simultaneously be eligible for multiple clinical trials, which can impact recruitment for any trial. In addition, clinical trials may compete for the same pool of patients, leading to recruitment challenges.
Regulatory and ethical considerations: Clinical trials are subject to regulatory and ethical considerations, which can impact patient recruitment. For example, specific patient populations may be excluded from a trial due to safety concerns, or the trial may need to be modified to comply with regulatory requirements.
Inaccurate assumptions: Predicting patient enrollment requires making assumptions about patient behavior, such as the number of patients eligible and willing to participate in the trial. If these assumptions are inaccurate, it can lead to over- or underestimating patient enrollment, impacting the trial's success.
Overall, predicting patient enrollment for a clinical trial is a complex task that requires careful consideration of many factors. Accurately predicting patient enrollment is critical for the success of a clinical trial, and careful planning and monitoring can help mitigate some of the challenges associated with patient recruitment.
Problems that we solved
At a high level, we have addressed the following issues:
- How to model patient enrolment at individual sites during a trial?
Using Discrete Probability Distributions to Model patient enrolment
- Can we predict the number of weeks in which enrolment activity (>=1 Patient) will occur?
- Can we predict the number of patients we can expect to enrol in 'n' weeks from now?
- Can we predict the number of patients we can expect to enrol by the end of the trial?
Our approach
This blog post will explore two statistical approaches to predict clinical trial enrollment counts: Poisson Distribution and Binomial Random Walk.
Binomial Distribution is a way to describe the probability of getting a certain number of successes in a fixed number of trials, where each trial has two possible outcomes (often referred to as "success" and "failure"). For example, let's say you're flipping a coin and want to predict the probability of getting a certain number of heads out of a certain number of flips. Binomial Distribution can help you make that prediction. The key thing to understand about binomial Distribution is that it assumes that each trial is independent of the others, meaning that the outcome of one trial doesn't affect the outcome of another. So, in the coin-flipping example, the chance of getting heads on one flip doesn't affect the chance of getting heads on the next flip. The two main parameters of binomial Distribution are the number of trials (often represented by "n") and the probability of success on each trial (often represented by "p"). In the coin-flipping example, the number of trials would be the number of flips you plan to do, and the probability of success (getting heads) would be 0.5 (assuming it's a fair coin). Using Binomial Distribution, you can calculate the probability of getting a certain number of successes (in our example, heads) in the fixed number of trials. For example, you can calculate the probability of getting 0 heads, 1 head, 2 heads, and so on. Overall, Binomial Distribution is a helpful tool for predicting the probability of getting a certain number of successes out of a fixed number of trials, each with two possible outcomes. It's used in many fields, including science, engineering, and business, to help make predictions and decisions based on data.
Poisson Distribution is a way to describe the probability of rare events happening over a certain period or in a particular area. For example, let's say you're running a lemonade stand and want to predict how many customers you'll get in an hour. You know from experience that, on average, you get 5 customers in an hour. Poisson Distribution can help you predict how likely you'll get a certain number of customers during that hour. The key thing to understand about Poisson Distribution is that it assumes that the events happen randomly and independently of each other. This means the chance of one event occurring doesn’t affect the chance of another event’s occurrence. For example, if you flip a coin, the chance of getting heads on one flip doesn't affect the chance of getting heads on the next flip.
Similarly, if you're predicting the number of customers at your lemonade stand, the chance of one customer showing up doesn't affect the chance of another customer showing up. In Poisson Distribution, the average number of events in a specific period or area is called the "lambda" value. In our lemonade stand example, the lambda value would be 5 customers per hour. Using Poisson Distribution, you can calculate the probability of getting a certain number of events (in our case, customers) during that period. For example, you can calculate the probability of getting 0, 1 or 2 customers, etc. Overall, Poisson Distribution is a helpful tool for predicting the likelihood of rare events happening randomly and independently. It's used in many fields, including science, engineering, and business to help make predictions and decisions based on data.
There are three primary questions that we will try to answer through this blog:
- Can we predict the number of weeks in which enrolment activity of any kind (>=1 Patient) will take place?
- Can we predict the number of patients we can expect to enroll in ‘n’ weeks from now?
- Can we predict the number of patients we can expect to enrol by the end of the trial?
Predict the number of weeks in which enrolment activity of any kind (>=1 Patient) takes place
This approach aims to predict the number of weeks in which patient enrolment will take place during a clinical trial. The approach uses statistical methods to model the probability of patient recruitment over time, using historical data from previous trials.

Fig : Binomial Random Walk
The first step in this approach is to model the number of weeks in which enrolment activity will take place using a Binomial Random Walk. The Binomial Random Walk assumes that the probability of success (i.e., at least one patient being enrolled in the trial) is constant over time but that the number of successful weeks follows a random walk. The random walk starts at zero and can move up or down by one week at each time step. The number of successful weeks is therefore modelled as a random variable that follows a Binomial Distribution.
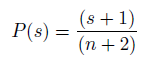
Laplace's Rule of succession is applied to calculate the probability of success for the next week. This rule assumes that the probability of success is proportional to the number of successes observed so far, plus one. The number of successful weeks observed so far is divided by the total number of weeks passed plus two to get the probability of success for the next week.
Once the probability of success for the next week is calculated, a random number is generated from the Binomial Distribution using this probability. The week is marked as successful if the generated number is greater than or equal to 0.5. If it is less than 0.5, the week is marked as failed. This process is repeated each week until the end of the trial to get the number of successful weeks.
To get a range for the expected number of successful weeks, the entire process is repeated 1000 times, and the number of successful weeks is recorded for each run. The range of successful weeks observed across all runs gives an estimate of the expected number of successful weeks and the uncertainty around this estimate.
Overall, this approach allows us to estimate the expected number of successful patient recruitment weeks and plan recruitment strategies accordingly. It is important to note that this approach relies on historical data and assumptions about the patient population and trial protocol, and the accuracy of the predictions may be impacted by unforeseen factors during the trial. Therefore, monitoring patient recruitment throughout the trial and adjusting recruitment strategies as needed is essential.
Evaluation
Different percentage of site enrolment historical data is considered to validate the approach. As we increase the historical data, predictions get better, and more sites follow the assumed distribution.

Fig : Historical data comparision
Predict the number of patients we can expect to enrol in `n` weeks from now
The approach described is a statistical method used to predict the number of patients enrolled in a clinical trial in the next two weeks. The method involves using Poisson Distribution, a statistical distribution commonly used to model count data.
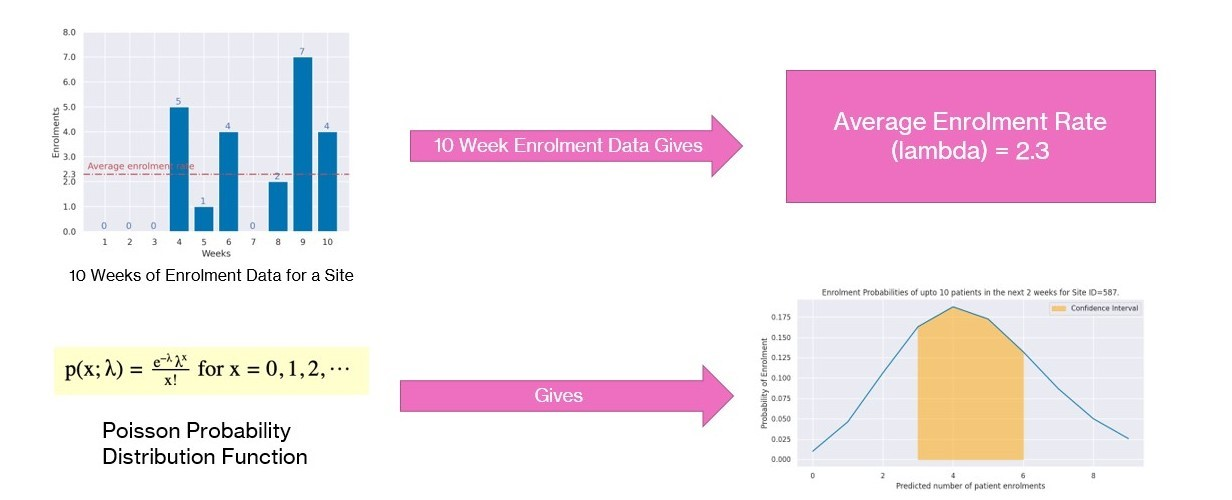
Fig : Enrolment prediction with confidence band
The first step is to gather data on patient enrollment from a site over the past 10 weeks to start the analysis. This data will be used to calculate the average enrollment rate, denoted by the symbol lambda. The average enrollment rate represents the expected number of patients enrolled per unit of time, in this case, per week.
Once lambda is calculated, the Poisson Distribution is used to model the probability of enrolling a certain number of patients in the next two weeks. The Poisson Distribution assumes that the probability of a certain number of events occurring in a fixed period is proportional to the average number of events in that period. In this case, the events are the number of patients enrolled in the next two weeks.
To calculate the probability of enrolling up to 10 patients in the next two weeks using the Poisson Distribution, we can use the following formula:
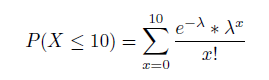
Where x is the number of patients enrolled, λ is the average enrollment rate calculated from the previous 10-week period, and e is the mathematical constant 2.71828.
This formula calculates the probability of enrolling 0, 1, 2, 3,... up to 10 patients in the next two weeks. The sum of all these probabilities gives the total probability of enrolling up to 10 patients in the next two weeks.
To calculate a confidence interval around this probability, we can use the normal approximation to the Poisson Distribution. The normal approximation assumes that the Poisson Distribution can be approximated by a normal distribution with the same mean and variance. The standard deviation of the normal distribution is calculated as the square root of lambda.
The confidence interval can be calculated using the following formula:
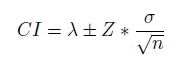
Where CI is the confidence interval, Z is the z-score associated with the desired level of confidence (e.g., 1.96 for 95% confidence), σ is the standard deviation of the normal distribution, n is the number of weeks in the prediction interval (in this case, 2), and λ is the average enrollment rate.
The confidence interval represents a range of values within which we can be confident (at a certain level) that the actual probability of enrolling up to 10 patients in the next two weeks lies. This interval can be used to make decisions about recruitment strategies, such as increasing recruitment efforts if the lower bound of the interval is below a certain threshold.
In summary, based on the average enrollment rate calculated from historical data, this approach uses the Poisson Distribution to model the probability of enrolling a certain number of patients in the next two weeks. A confidence interval is calculated using the normal approximation to the Poisson Distribution, which estimates the uncertainty around the predicted probability. This approach can inform recruitment strategies and make data-driven decisions about patient enrollment in clinical trials.
Predict the number of patients we can expect to enrol by the end of the trial
Patient enrollment is a critical component of any clinical trial. One of the biggest challenges in clinical trial management is accurately predicting the number of patients who will enrol in a study. Accurate enrollment predictions are necessary to ensure the study will be completed on time and within budget. Statistical methods predict the number of patients enrolling in a clinical trial, and one such method is the Poisson Random Walk.
The Poisson Distribution is used to model the number of events that occur in a fixed time interval. For instance, if we want to know the number of patients who will enrol in a clinical trial next week, we can use the Poisson Distribution to model this number. The Poisson Distribution assumes that the events are independent of each other and occur at a constant rate. In the context of clinical trials, we assume that patient enrollment is independent of any external factors and occurs at a constant rate.
We must first calculate the average enrollment rate lambda to use the Poisson Random Walk to predict patient enrollment. We can calculate this rate by dividing the total number of patients enrolled by the number of weeks that passed. For example, if we have enrolled 100 patients in 20 weeks, our average enrollment rate would be 5 patients per week
Fig : Poisson Random Walk
Once we have calculated lambda, we can use the Poisson distribution to generate a randomly expected enrollment count for the next week. The Poisson Distribution gives us the probability of observing a certain number of events in a fixed interval, given the average rate at which the events occur. For instance, if our average enrollment rate is 5 patients per week, the Poisson Distribution can tell us the probability of enrolling 0 patients, 1 patient, 2 patients, and so on in the next week.
We can use the randomly expected enrollment count generated by the Poisson Distribution to update our estimate of the average enrollment rate lambda. If we enrol more patients than expected in a given week, we will update our estimate of lambda to be higher, indicating that we expect to enrol more patients in the future. If we enrol fewer patients than expected, we will update our estimate of lambda to be lower, indicating that we expect to enrol fewer patients in the future.
We repeat this process for each remaining trial week, updating our lambda estimate using the predicted enrollment count generated by the Poisson Distribution. At the end of the trial, we can add up the expected enrollment counts for each week to get the total count of enrollments for the site.
However, we can't rely solely on a single Poisson Random Walk prediction. We need to repeat this process many times to account for the uncertainty in our estimates of lambda and the random variability in patient enrollment. This is where Monte Carlo (MC) simulation comes in.
We repeat the above Poisson Random Walk process 1000 times using MC simulation, generating 1000 scenarios for patient enrollment. Each time we repeat the process, we update our estimate of lambda based on the expected enrollment count generated by the Poisson Distribution. After 1000 repetitions, we will have a distribution of possible total enrollment counts, each with a different probability of occurring.
Finally, we can use the distribution generated by the MC simulation to determine the range of expected enrolments. We can calculate the 95% confidence interval, which gives us a range of values within which we are 95% certain the actual value lies. This range will give us a more accurate clinical trial patient enrollment prediction.
Evaluation
The above approach is tried by considering different percentages of historical enrolment data to calculate the initial enrolment rate (lambda) required for the Poisson Distribution. It is concluded from the results that as historical data is increases, predictions get better, and more sites follow the Poisson Distribution for the patient's enrolment.

Conclusion
Predicting enrollment counts in a clinical trial is a critical step in trial design and requires careful consideration of multiple factors. The Poisson Distribution and the Binomial Random Walk are valuable tools for predicting enrollment counts and can provide complementary insights into the enrollment process. Through this blog, we will develop a generalized methodology to statistically model a patient enrolment process.
We will be covering extensions to this approach in a later blog article.
Custom IT Solutions
Leverage our capabilities and insights to accelerate your digital transformation
